
How Can a Forensic Accountant Assist With a Dairy Farm Loss?
 13 May, 2024
-
 Conor Paxton
 -
 Canada
How can a forensic accountant assist with a dairy farm loss? Typically, a trigger event causes a farm to impede its operations. MDD may be retained when this occurs to quantify the loss from milking operations or other aspects.
Background on the Dairy Farm Industry
Looking at historical dairy farm statistics, we can see that revenue growth and the number of cows follow a similar trend. However, the number of establishments on the black line shows a slow decline.
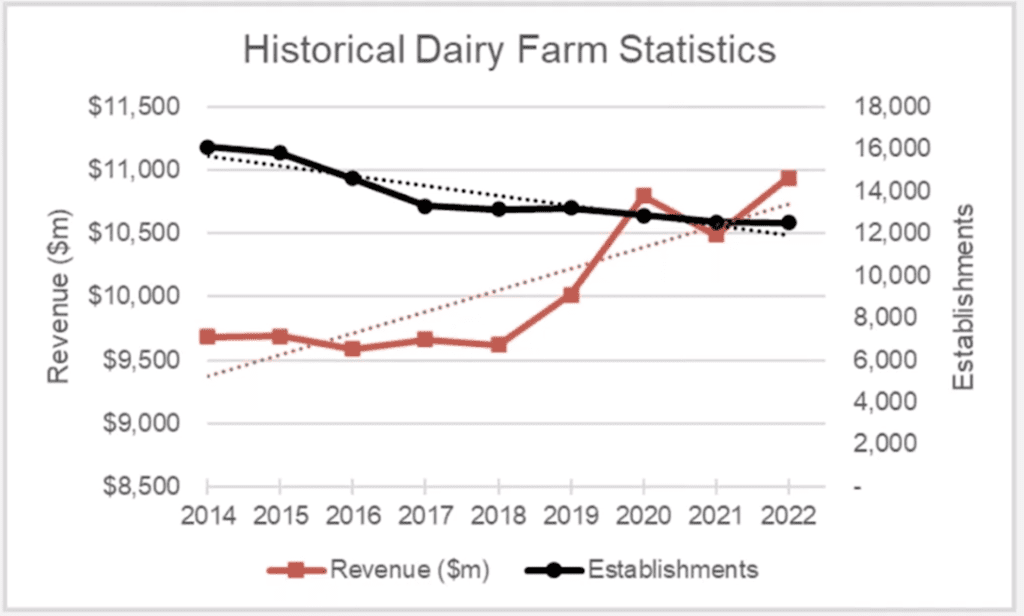
What is important to highlight above is that this indicates market consolidation. We can also see that there’s support for the increase in herd size by establishment.
The next graph shows that the number of cows follows a similar trend to revenue. While there is a slight dip in 2022, the number of individuals employed declines. In recent years, robots and other farming technology can account for this drop in employment. For example, farms now use a manure discharge system, which removes the need for farmhands. Other technology includes using a TMR feed mixer and herd management technology to improve the efficiency of farm operations.
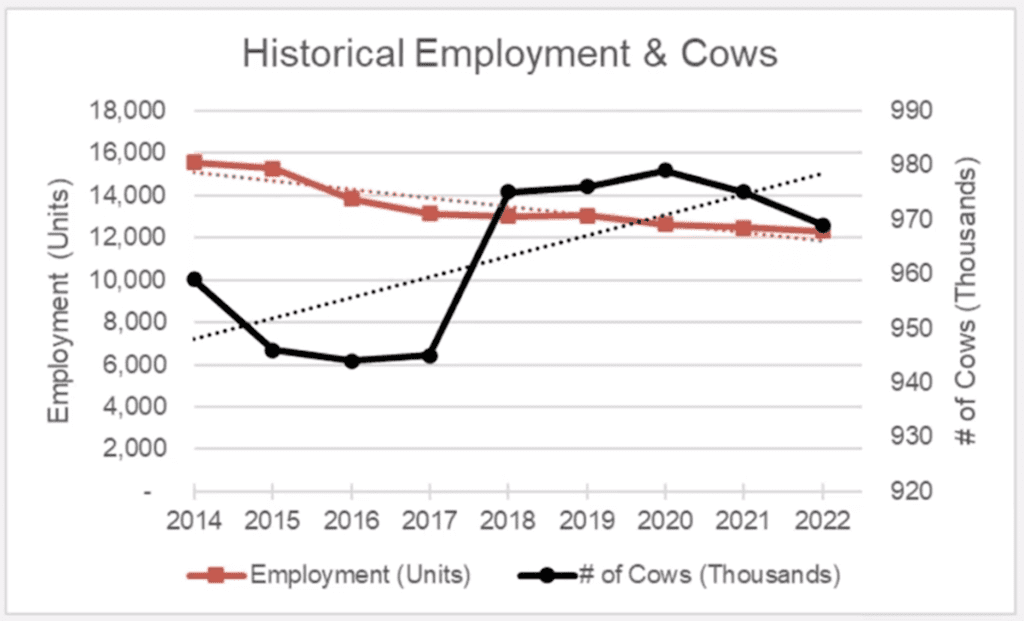
Historically, dairy farming has been a very labour-intensive industry. Generally, a day for family-run farms would involve waking up in the morning, hand milking the cows for hours, morning and afternoon, and then tending to the crops. More significant operations are now purchasing small family farms, with larger operations using more technology.
Recent data shows the projection of sustainable growth going into the future.
Understanding Dairy Operations
How does a dairy farm operate?
The following graph shows a lactation cycle. The number of months is displayed horizontally, with the quantities shown vertically.
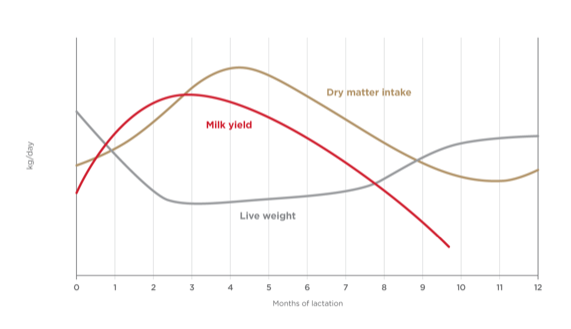
A typical dairy cow’s gestation period is about nine months, close to humans. The goal is to have them calve or give birth every 12 months, produce milk for 10 months, and then be dry (i.e., not producing milk) for two months.
The cow would calve and start producing at zero on the graph, which rapidly increases in the first couple of months. Usually, around the two-to-three-month period, they try to inseminate the cow again. Around that third month, the hope is that the cow will be pregnant again, and then for the next seven months (from month 3 to month 10), the cow will continue to produce milk.
Around month 10, they start drying off, and we see milk yield decline as we approach month 10. The last two months are the last two months of pregnancy, right before the cow gives birth again. Over the previous two months, the milk production drops to allow the cows to prepare for that next birth, and then the cycle repeats itself.
In a situation where all cows give birth in the same period, there would also be a dry period where the cows do not produce milk. To avoid this, farms time their pregnancies to have constant milk supply production throughout the year.
Lifespan of a Dairy Cow
The natural lifespan of dairy cows is typically about 15 to 20 years. However, the milk production lifespan is between 3 and 4.5 years, meaning the cows can be used for two to three calving cycles and then sold to slaughter afterwards.
Male calves are typically raised for veal or beef or can be kept for bull breeding.
Milking Patterns
The typical milking time using modern technology takes about 5 to 10 minutes, occurring two to three times daily, depending on the operation. Milking will take much longer if the farmer is milking by hand.
A cow typically produces about 30 litres of milk daily; the caveat is that it depends on where the cow is in the lactation cycle.
Dairy operations are different; some focus on providing the cows with the best nutrition and comfort to maximize production.
Unfortunately, others may focus on keeping their costs down by feeding their cows less quality food and not paying close attention to their welfare. However, this can often hinder milk production.
Dairy farms can also generate revenue through other streams, such as selling cattle, embryos, and crops.
Common Dairy Farm Terminology
- Calf – a newborn cow
- Heifer – a cow that hasn’t given birth.
- Fresh cow – a cow that has recently given birth.
- Dry cow – a cow that is no longer producing milk.
- Bull – a male cow whose main purpose is reproduction.
- Dam – a mother of a calf
- Sire – a father of a calf
Dairy Farming Regulations
Canada has a national federation of provincial counterparts such as Alberta Milk, Dairy Farmers of Manitoba, etc. All provincial organizations operate under a supply management policy, and the insurance production levels are limited by the number of quotas the farm holds. This avoids overproduction and instability in the marketplace. It provides security for the dairy farmers themselves and ensures pricing reflects the capital and labour costs while considering the state of the Canadian economy.
Analyzing Milk Statements
The right-hand side shows the milk picked up from April 1 to April 30, and at the bottom, you will see its total highlighted of approximately 57,000 litres.
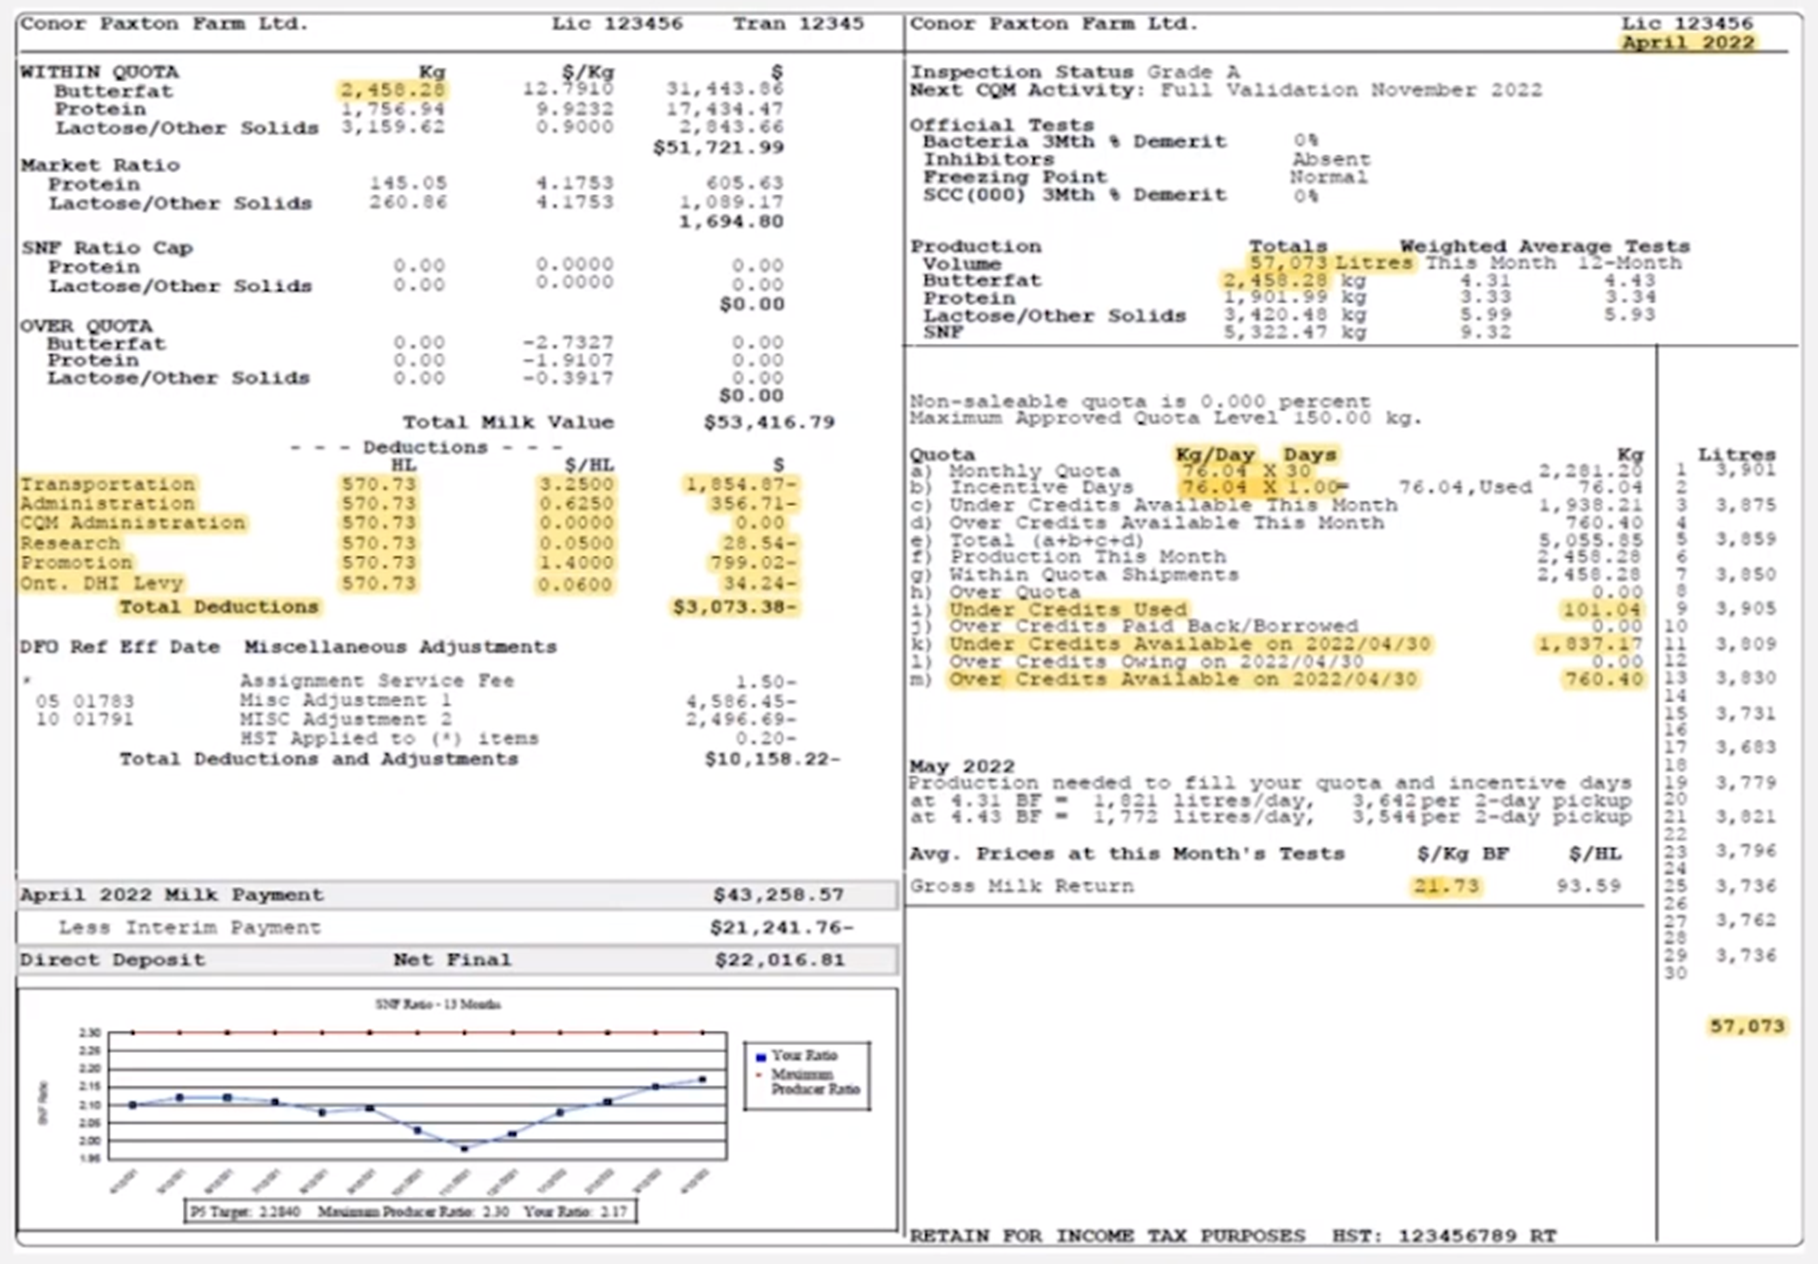
This tells us that milk is picked up every two days, which is essential when calculating a loss. In a scenario where a fire has destroyed everything, you must account for losses from the day before and not just from the date of loss onward. It is common for larger operations to have daily milk pick-up.
Underneath production, we have the total volume, the butterfat, protein, lactose, and SNF. Every liter of milk has a breakdown of what is in that milk.
The largest percentage is butterfat. Then there’s protein, lactose, other solids, and then SNF, which stands for solids that are not fat – everything else that is not considered fat.
In this statement, they produced 2,458 kilograms of butter fat, equivalent to a 4.31% butterfat content. The butterfat is what the DFO and the provincial bodies regulate.
The quota section has a monthly quota of 76.04 times 30 days. In this case, this operation has purchased the license to operate 76.04 kilograms of butter fat per day, multiplied by 30, equaling 2,281.
They are over that quota based on what they produced, i.e., they overproduced their allotment.
Underneath the monthly quota, you can see incentive days. In this case, it is the same daily quota of 76.04 multiplied by one. Next to this is a comment showing what has been used. One day is available at 76 kilograms daily, which equals 76 days available. All 76 incentive days were used to fill the additional quota in this case.
Periodically, the governing bodies will allow incentive days for the farm to get the supply they might need. Incentive days will enable the farm to produce additional supply and meet demand in the dairy market.
In this case, they produce 2,450 with their incentive day of 76 kilograms. The farm has still overproduced above their monthly quota and incentive dates, where over and under credits come into play.
Ontario has some limitations, but a farm can overproduce ten days of its quota. In this case, the daily quota is 76 kilograms, so they could overproduce 760 kilograms before being penalized.
Similarly, there are under credits, so they can also underproduce. As they underproduce, they accumulate credits, which, when you overproduce, can bring the farm back up to equilibrium before they must use the over credits. In this case, they used some of the under credited balance they had available to meet that production they overproduced.
On the left-hand side of the statement is where you can see the revenues and base expenses. At the top, you can see the 2400 kilograms of butter fat they produced and the other components of protein and lactose. Then, under this, you can see they have made around $53,000 on this milk check.
The other items highlighted below are transportation and administration. Those costs are deducted for the milk to be picked up and transported.
Finally, the information near the bottom right-hand side is 21.73, which is the dollar per kilogram of butter fat, revenue on a gross basis per kilogram, or the price of each kilogram.
For dairy farm losses, we typically request these for about 12 or 24 months before an incident and afterwards because it will show a trend for the operation’s quota. We can see whether the quota was increasing, whether they had purchased additional quota, were consistently filling it, or were overproducing or under-producing, etc.
A lot of information on the milk statements comes into our analysis to understand what an operation has done historically and what they would do and are doing after a triggering event.
Other Regulations and Considerations
To mitigate a loss, the impacted farm can enter into an agreement to have another farm fulfil its available quota. This is often used if the farm did not lose all cows in the incident.
Some other considerations in loss calculations would be the loss of cow sales, as this will impact the revenue streams and the dairy operations. Other interesting aspects and diversification of revenue include the solar panel revenue losses, loss of sales for genetics, and cost savings associated with the grown feed.
The biodigester losses are another consideration that comes into play with larger operations.
Much of the waste or feedstock for biodigesters comes from cattle and farm operations. Suppose that feedstock is no longer being supplied because the cows are deceased. In that case, additional feedstock may need purchasing. Also, if your biodigester is generating electricity that is sold to the grid, similar to a solar panel, it could be a source of income that is lost.
We often see an increase in fertilizer costs if the entire herd has died. In this situation, if they are growing their crops, they would use the cow’s manure fertilizer to fertilize them. If that source of manure is gone, they must still fertilize their crops. They usually buy chemical fertilizers, half of which are typically more expensive than manure, which is just the byproduct of the dairy operation.
Many of these operations do not just rely on manure; they use manure and top it up with other chemical fertilizers. It is essential to understand what their historical fertilizer costs typically are and then what they are now and then calculate that incremental amount.
Basic approach to calculating Dairy Farm Losses
Step 1
The first step is to calculate the milk production shortfall. To calculate the milk production shortfall, we must determine two inputs.
The first is what milk production would have been without this event—an example of a fire that destroys the whole milking barn, killing the herd and operations. We would use milk statements to assess the historical trends and determine the level of milk production after the incident, which will likely be zero or, if it’s not a total loss, somewhere in between. Deducting those two quantities will give you the milk production shortfall.
Step 2
Step two is where we would apply the price to the shortfall from step one and use a current price. We would use the historical milk statements to see the milk prices. But because we are looking at what they would’ve sold during that period, we want to know the current milk price, and we can usually get that from the existing milk statements. So, we would multiply the shortfall in production in step one by the current price in step two to bring you the loss of revenue from the shortfall.
Step 3
Step three is where we would deduct saved or avoided expenses. Suppose an operation has ceased or been reduced. In that case, there is likely a cost that they would’ve had to incur to generate that level of production that they no longer have to, so there’s a consideration of saved expenses that we need to deduct from step two.
Step 4
Step four is the opposite of the above and might include things like fertilizer costs to continue the operations and things as usual. There’s an increase in expenses that need to be incurred.
Dairy Farming Case Study 1
This case study involves a farm in Ontario. The farm has purchased a quota of 75 kilograms.
This situation has a 12-month indemnity or closure period with no incentive days.
On January 1, 2023, a windstorm destroyed half of the barn’s roof. None of the cows perished, and the farm could continue to operate as usual.
However, because half of the roof was destroyed, a temporary blockade was constructed, and the cows were all pushed into a much tighter environment in 50% of the barn. Due to being squeezed together, their milk production drops.
In many cases, cows’ production is affected by their environment, how they are fed, and how they feel. Sometimes, an environmental change or a stressful event can affect milk production.
Using the approach above, step one would look at the production shortfall.
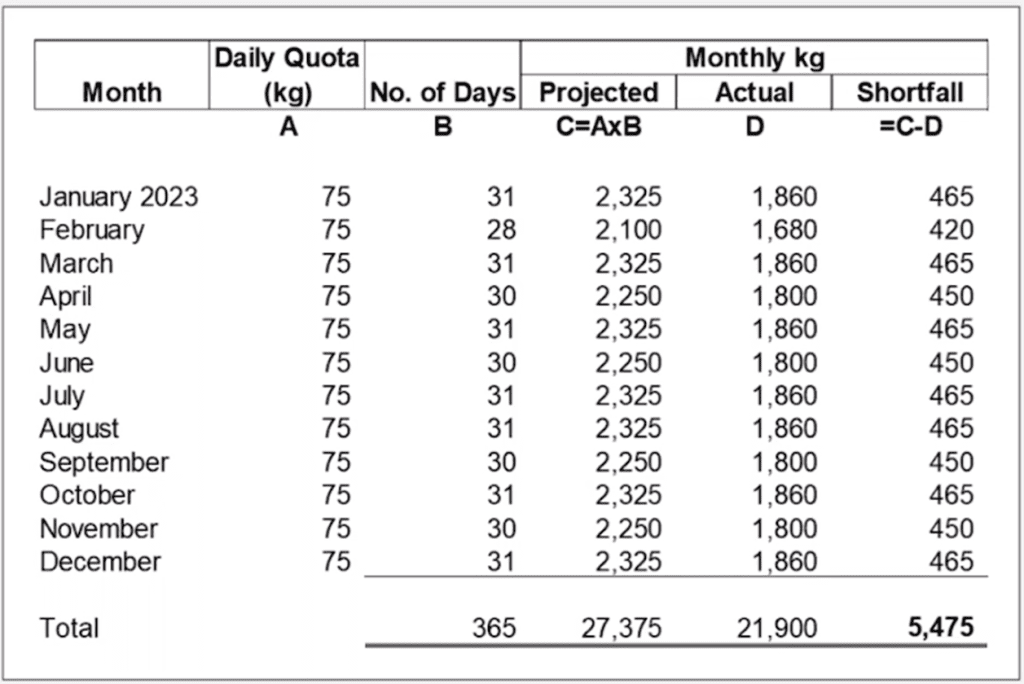
We have steps to calculate production across the top in the above 12-month period.
We have simplified the daily quota in this example, where we’ve assumed the quota is 75 kilograms a day. In a real-life example, the quota can fluctuate as farms buy and sell and may be given more quota throughout the period.
With the number of days each month, we can project what the monthly kilogram production would have been had the windstorm not occurred, which equals 27,000 kilograms of butter fat being produced.
The next column is what they have produced. In this scenario, the production is reduced by about 20% from the cows being squeezed together, so they’ve only been able to produce 21,900 kilograms of quota.
By deducting the actual from the projected we can see that they’ve lost about 5,475 kilograms of quota that they could have produced had this windstorm and roof damage not occurred.
In step 2, we would take the 5,475 and apply the price per kilogram at the current pricing to get the revenue shortfall. In our scenario, we have assumed constant pricing throughout the whole period. Still, in a real-life situation, the prices may increase or decrease, impacting the revenue they would have received.
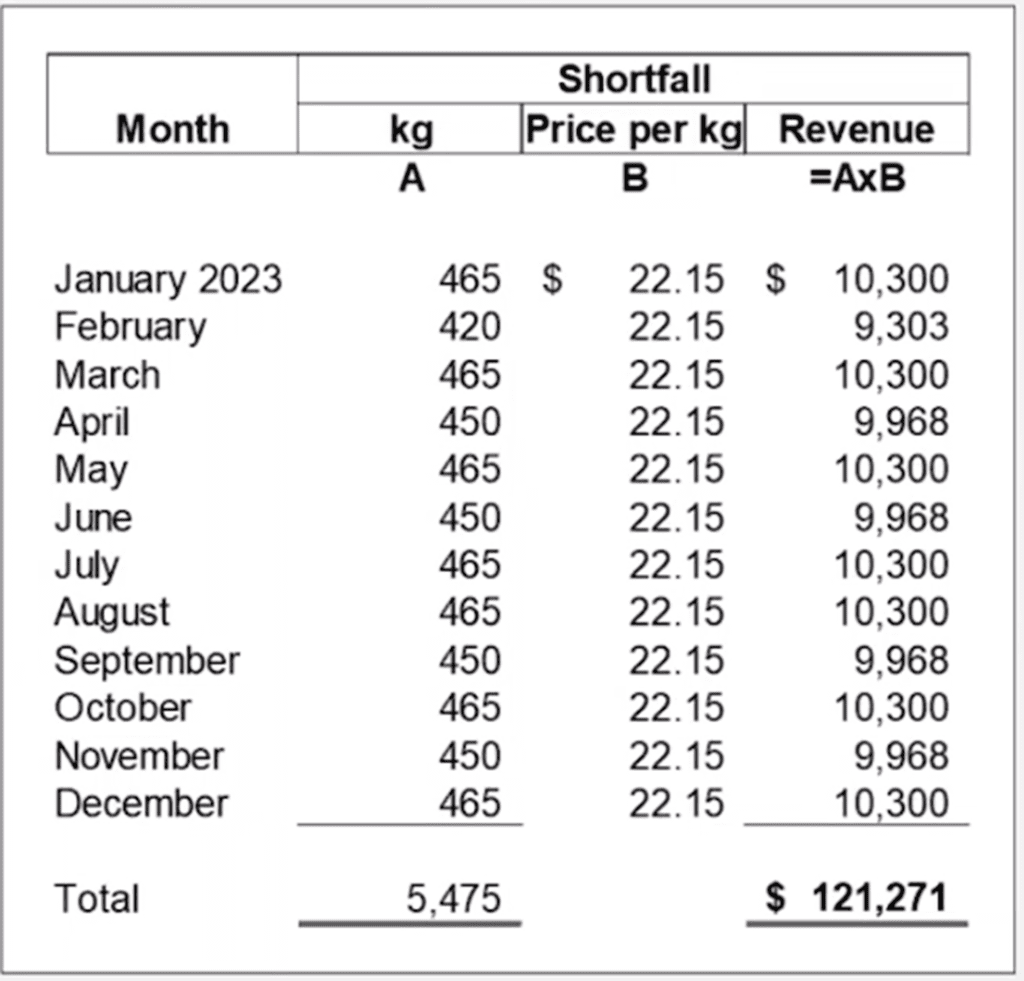
In this scenario, we calculate that they would have lost $121,271 of revenue from the lack of production.
In the next step, looking at saved expenses, we must consider that all the cows survived and are still producing milk.
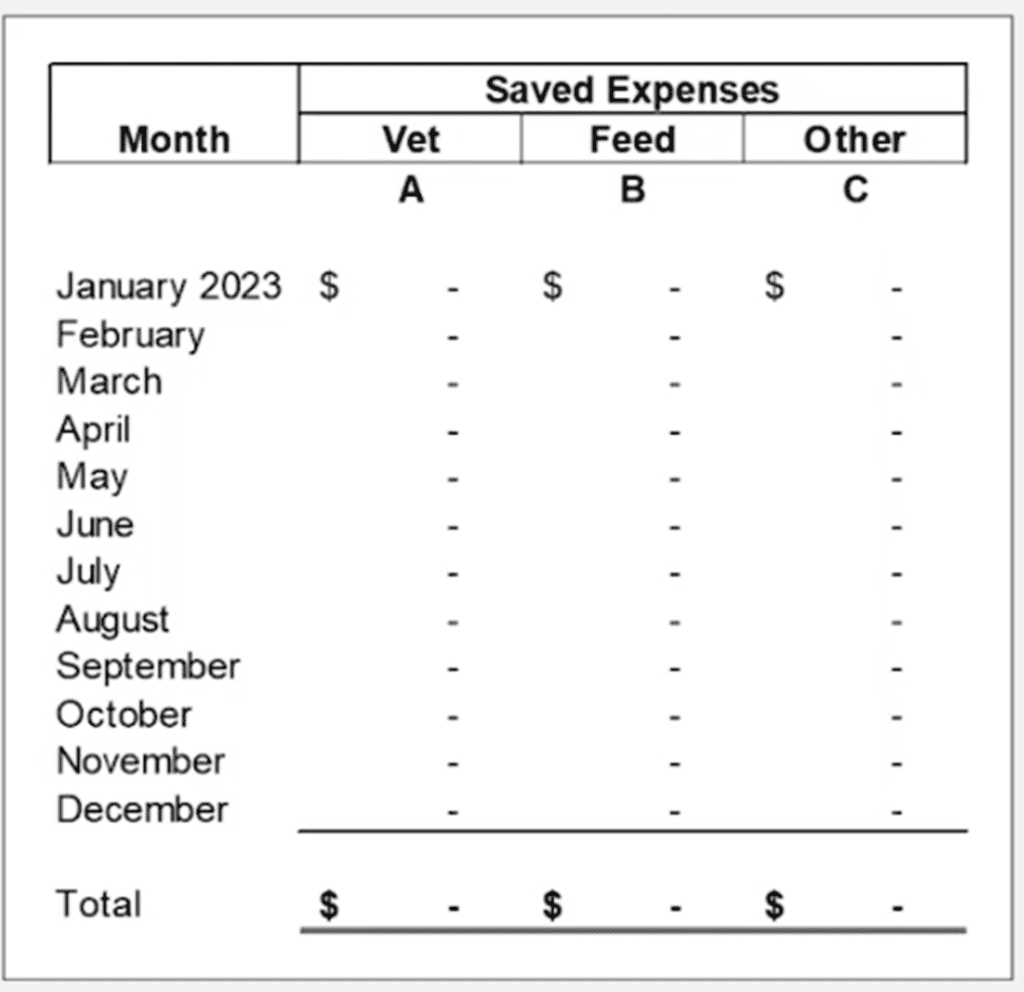
The operations continued as usual, other than 50% of the building being blocked off while they fixed the roof. In our scenario, we assume all the animals still need to be looked after. So veterinary expenses continue, and the cattle still need to be fed, so there’s no savings in feed.
In addition, we’ve assumed this continued when considering the other expenses category, i.e., the repairs and maintenance. So, in this case, since all the expenses would continue as expected, we have not considered any saved expenses. Therefore, in step three, the number is zero.
In step 4, we consider the increase in costs. In this situation, we assume that everything has continued as usual and no additional charges have been incurred. A potential cost to consider here, however, is if they had to send some animals off to another farm to board elsewhere and they had to pay for that boarding cost.
In summary, when we put all the steps together, there was a production shortfall of 5,000 at a 20% reduction. Applying the price of 22.15 per kilogram gets you to the revenue shortfall of £121,000, and then because there were no saved costs or increased costs in steps three and four, the net loss remains at £121,000.
Dairy Farming Case Study 2
Suppose we take the same case background above and modify a few case facts. The farm is still located in Ontario. The purchase quota for this example remains at 75 kilograms.
No incentive days are offered for the 12-month indemnity period (although we did note it was unlikely.) What is different about this case is that a fire destroyed the entire barn on January 1, and on top of that, all the cows perished as a result of the incident, and operations ceased for 12 months.
To add one more case fact, the farm can find four other producers to fill their quota, and the farm pays them 70% of their milk check for the quota they can fill, i.e., the farm would keep 30% of that.
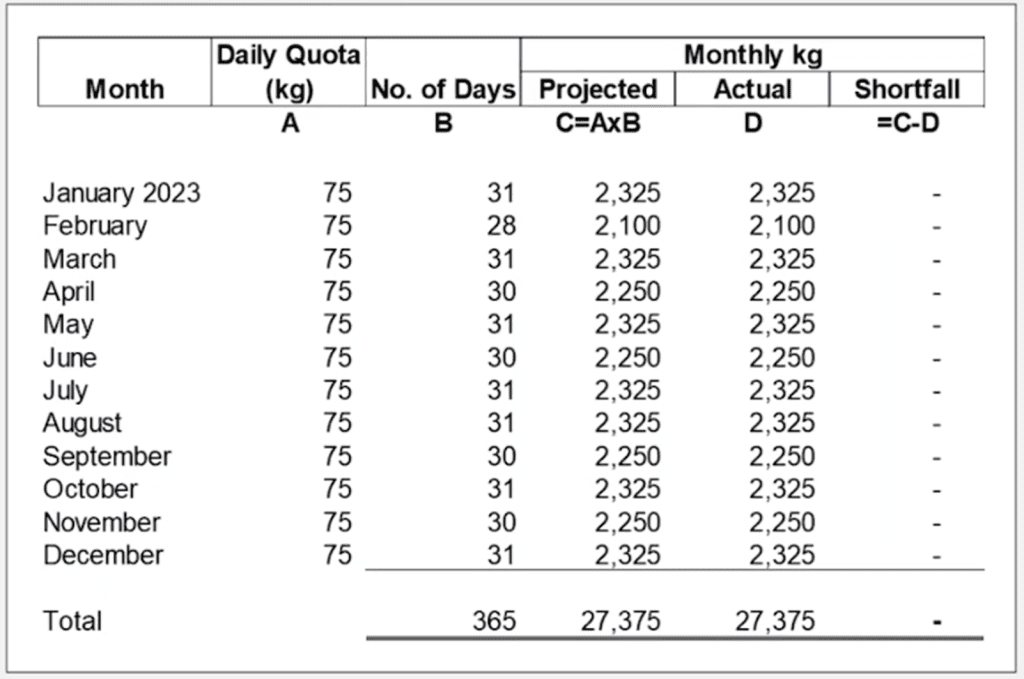
Utilizing the four-step approach, like the last example, we still assume the quota would stay the same and not increase or decrease for this example. Again, this is an illustrative example, and deviations can vary from actual practice. It is important to note that we assume they would fulfil one hundred per cent of the quota, looking at historical trends and believing four other farms fill one hundred per cent.
There is no shortfall in kilograms or revenue because the farm fulfilled its quota using milk from the other four farms.
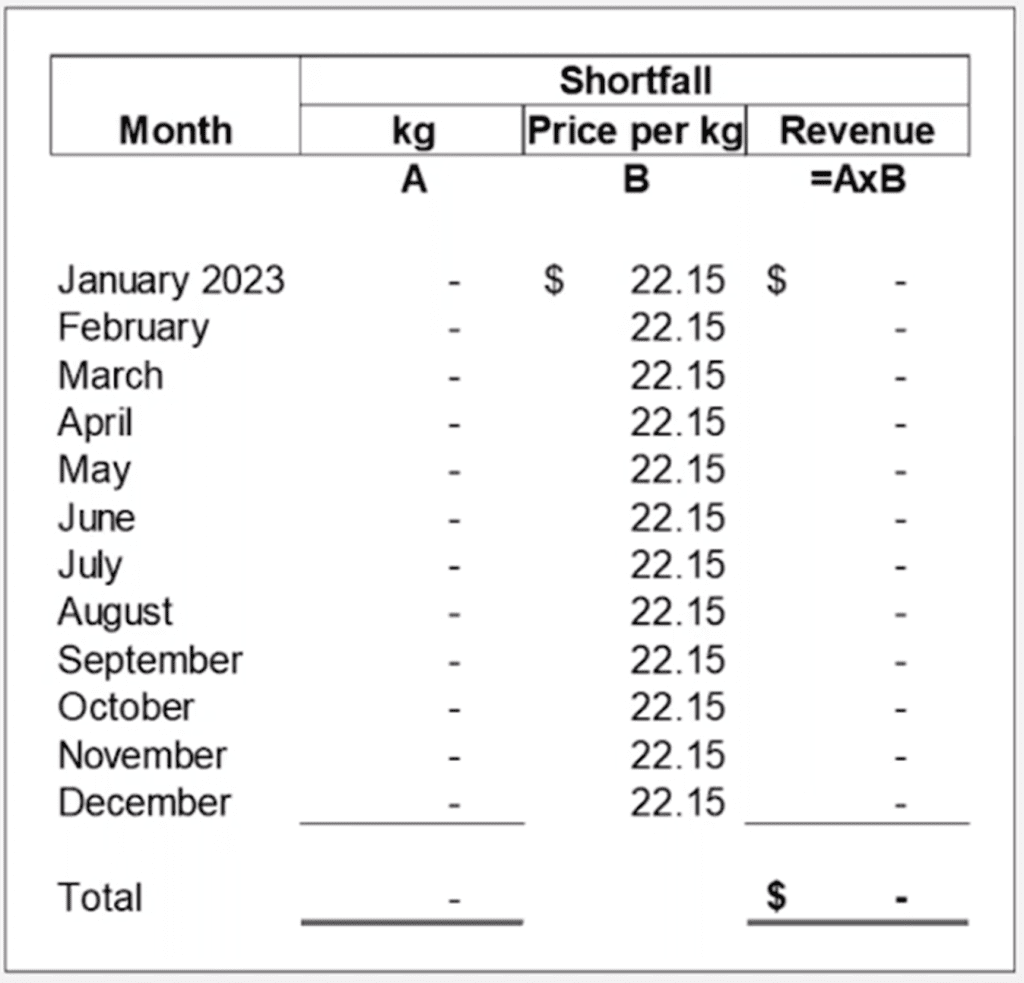
In step three, it’s important to note that all the cows perished due to the fire, and the operation ceased.
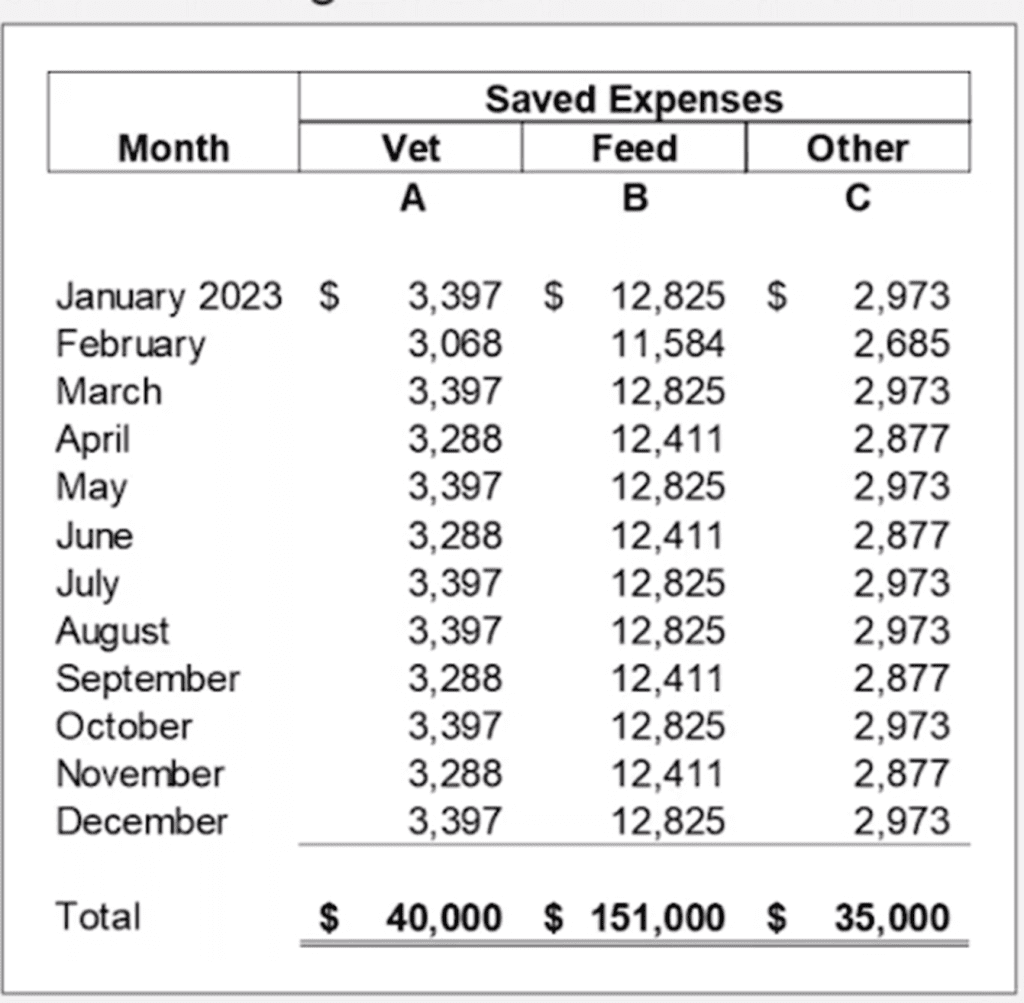
There are significant saved expenses to note. Examples include vet fees, feed, labour, repair and maintenance, and capital expenditures.
In this example, we concluded that there were about $40,000 of vet-saved expenses, $151,000 of feed-saved expenses, and other saved expenses of $35,000.
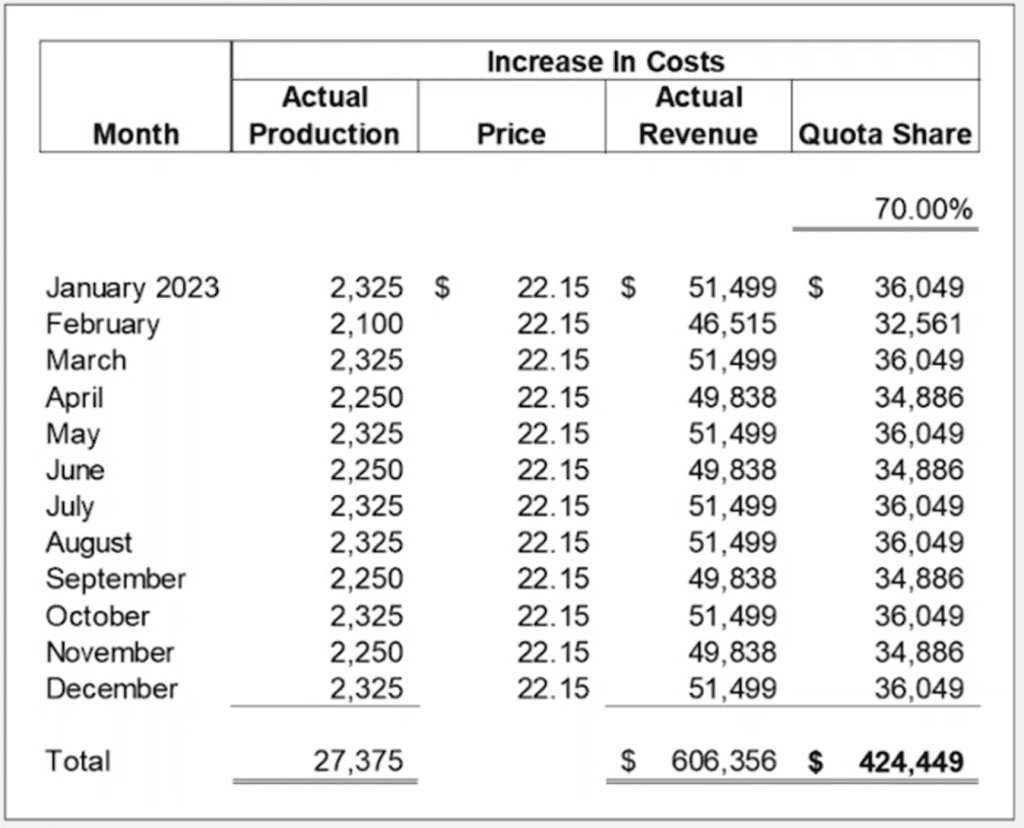
Regarding increased costs, the amounts paid to other farms to fulfil the quota are $424,500, bringing us to a net loss of $198,449.
The statements or comments contained within this article are based on the author’s own knowledge and experience and do not necessarily represent those of the firm, other partners, our clients, or other business partners.

Conor Paxton
BA, CPA, CA, CBV, CFE, CFF, Senior Manager/Vice President
- +1 613.389.3176
- cpaxton@mdd.com
- Kingston, ON, Canada
Articles
Relevant Articles
Our experts are extremely knowledgeable about thier subject areas and often write educational material and commentary on topical issues they come across.

CAT Spotlight – Iceland eruption
In this CAT spotlight, we focus on Iceland, situated on the Mid-Atlantic Ridge, a country prone to volcanic eruptions, earthquakes, and glacial floods. The most well-known CAT event in recent times was the March 2010 Eyjafjallajökull eruption. Most will remember...

How Can a Forensic Accountant Assist With a Dairy Farm Loss?
How can a forensic accountant assist with a dairy farm loss? Typically, a trigger event causes a farm to impede its operations. MDD may be retained when this occurs to quantify the loss from milking operations or other aspects. Background...

CAT Insights – The Increasing Risk and Frequency of Wildfires
Depending on where you are located, you are likely to experience some sort of “weather disaster season,” such as hurricane season, cyclone season, tornado season, earthquake season, or wildfire season. I live in California where we have earthquake season, which...

Property Damage and Derechos
On 29th June 2023, a rare type of storm called a "derecho" swept across the Midwest region of the United States, mostly impacting the states of Missouri, Illinois and Iowa. The derecho began as a rotating supercell thunderstorm that spawned...

Lost Profits Measurement in the Cannabis Industry
What used to be considered an illicit drug in most countries is now a decriminalized plant with some medicinal potential. Cannabis is in the midst of a global transformation into a major industry with massive investment and growth potential. Canada...

Business Interruption Losses Involving Dairy Farms
As anyone who followed the debate over the USMCA trade agreement last fall will know, Canada’s dairy industry is a regulated one. As a result, business interruption calculations involving dairy farms will often contain a number of moving parts that...

Agricultural Loss – Quantifying Economic Damage for a Hog Farm
Damage quantification for livestock losses can be difficult as it often requires consideration of market price fluctuations, age and weight of livestock at the time of loss and the end purpose of the livestock - considering whether they are for...
